The client
National Medical Legal Partnership strives to improve the health and well-being of people and communities by leading health, public health and legal sectors in an integrated, upstream approach to combating health-harming social conditions. In short, MLP recognizes that legal issues and medical issues are often related and intertwined. By creating awareness and procedures for legal and medical staff to work together, they can serve patients more effectively. However, understanding the issues and how to navigate can be complicated.
The project
National Medical Legal Partnership (MLP) asked Opus Design to design an issue brief with them. An issue brief is similar to a small report or whitepaper. In this issue, they needed our design agency to style, format, and redesign the report infographics, to better visualize how this partnership between medical and legal care for patients can take place.
Design challenge and approach
We have designed several reports for MLP, so the style was consistent with reports and issues from the past. The infographics were the really fun part of the project. MLP pulled together their ideas for the infographics, but they need to be designed to look professional. They asked us to make them more clear, more concise, and understandable to more people.
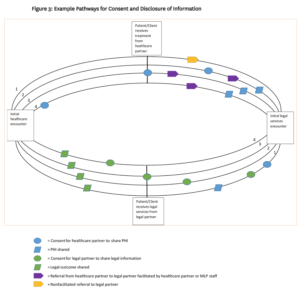
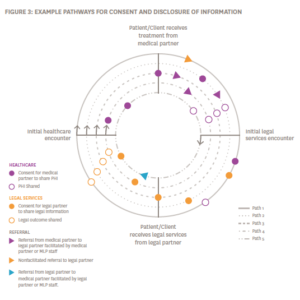
Emily, our Sr Graphic Designer specializing in information design, took their simple drawings and made them stand-out and memorable. Below is an example of a before and after.
The second infographic Emily took from interesting ideas to a clear, clean design. This is a very complicated graphic. Notice there are 5 different paths the patient could take, noted now by different line types. The colors are now more concise and the shapes more easily understandable. The purple is now just health care professionals and the orange legal professionals. Instead of 4 different shapes, there are now 2 shapes with solid circles and outlined circles. All of these changes make the infographic clearer and memorable.
Every issue brief we do for them has a similar style and yet very distinct features. The report infographics are a special way to use great graphic design to create effective communication tools.
